Top 10 Key lessons of Data StoryTelling Skills with Neil Montes - Weekdays & Weekends Batch
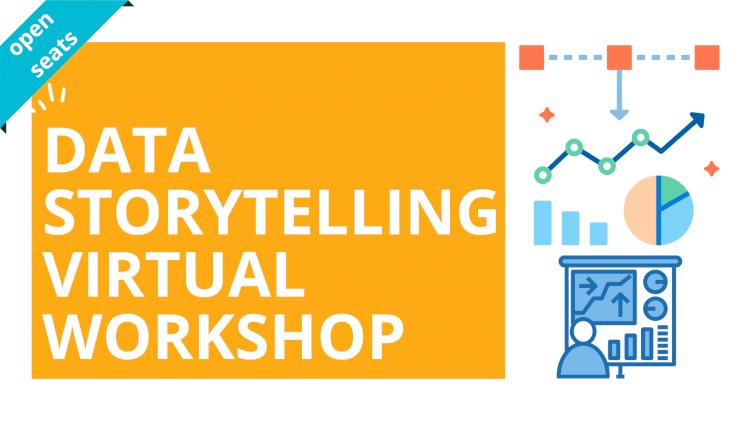
Virtual Workshop: DataStoryTelling Skills with Neil Montes
Travel may be paused, but we remain committed to helping participants learn to effectively communicate with Data through stories whether in person or virtually.
To that end, We are transitioning our next public workshop on "Data Storytelling Skills" into a virtual live training experience.
“ The Data Storytelling Skills Live Workshop with Neil Montes ”
Weekday Batch 1 - 10 days 10 Modules ( Each Day - 1 Module of 1 hr each)
Weekend Batch 2 - 4 Days 10 Modules( Each Day - 2 & 1/2 hours )
Cost (Rs ) - 2499 per person ( Inclusive of GST) (Promotional Pricing*)
That is 10 hours of exciting and experiential live training experience delivered over 2 weeks assisted by hands-on exercises, live polling, chat and world class video conferencing.
It will be delivered by the amazing Data Storyteller -Neil Montes with 15 years + experience in communicating data. He has worked in companies like SAS Institute, PayPal, eClerx etc with clients like Citibank, Dell, Walmart, HDFC Insurance, Vodafone, Amazon among many others.
So, Is it for me?
If you need to communicate numbers, data or make presentations, you should attend.
Are you responsible for representing data in your day-to-day job? Is it important for you to be able to tell stories through charts and presentations?
If you ever find yourself needing to communicate something to someone using data, this virtual training is just for you!
A manager? An analyst? From these functions…Marketing, Finance, Operations, HR, Leadership, etc……..
In this workshop, you’ll learn how to articulate what the data is saying, visualise it to convey insights and your recommendation. Finally, you'll use the language of data, narrative and stories to structure it in a way that creates action and convinces the audience. The results will be obvious to you with immediate results in your job.
Forbes called it the Data Science and Communication skill for everyone. Linkedin put it in the top 5 things to get better at in 2020. So just go ahead and book this very rare training that is being provided at a very promotional pricing.
Tell me more about the virtual training?
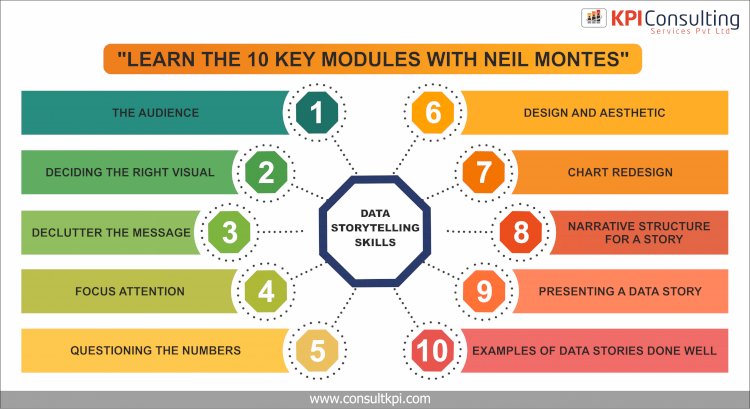
The workshop is divided into 10 key lessons (aka. modules) and is a mix of data visualisation, storytelling theory, best practices, and real-world data games /exercises.
Module 1: Understanding the audience
Module 2: Deciding the right visual
Module 3: Declutter the message
Module 4: Questioning the numbers
Module 5: Focus attention
Module 6: Design and aesthetic
Module 7: Chart redesign
Module 8: Narrative structure for a story
Module 9: Presenting a Data Story
Module 10: Examples of Data Stories done well
The focus will be on best practices and is not tool-specific (examples are primarily Excel-based, but concepts can be applied in any graphing application, analytical or presentation software)
Then there is the bonus that is provided to you:
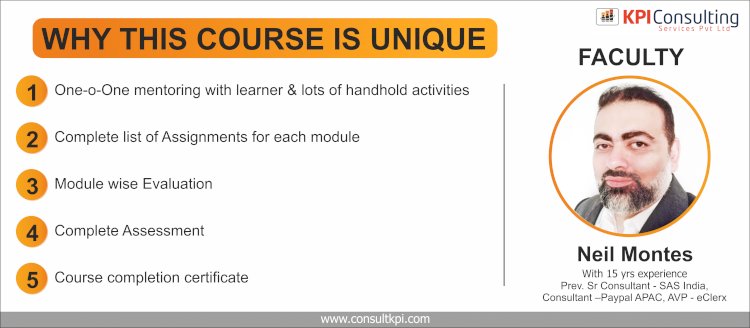
- A certificate of completion
- One on one 20 min Q&A session with Neil Montes
- Data Presentation feedback recommendation to each participant
- A 360-degree Assessment
- Individual homework exercise feedback to each participant
- Each module has home exercises
- A workbook with “How to” Chart exercises
- The Data Storytelling checklist
- A Compilation of links of secret data tools that help you be awesome
The Special Sauce
- This is an interactive live workshop with feedback and discussions and not comparable to any other online recorded training in the market
- There are home exercises, data games and a path ahead provided, making it an experiential workshop.
- We take a survey after each workshop and we have always scored excellent (4.83/5) with people loving the clarity, great content and energising inputs
- This workshop is an essential part of the leadership training, communication training and data science training of leading Indian and Global companies
- There are workbooks, freebies, checklists provided as a bundle at the most optimum initial price
- It is up to date and cutting edge. (We even added coronavirus examples..)
- The speaker is an initial member of The Global Data Visualisation Society where global experts share knowledge on the best practices and experiences that find a way in this course
- This is a course with an established certificate that you can add to your resume to show your learned skill in working and communicating with data
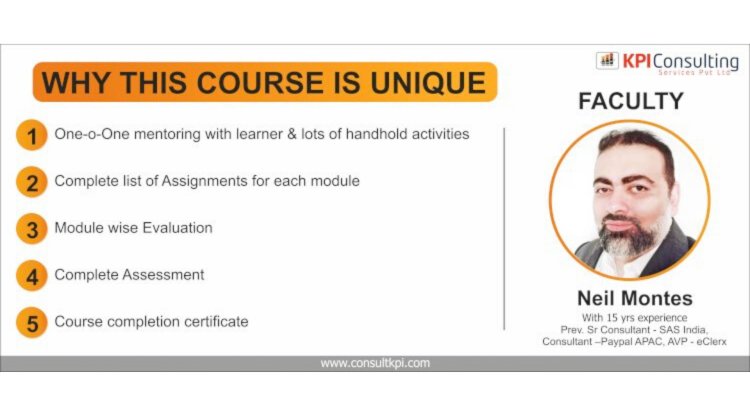
About the Speaker
Neil Montes is well-known as a thought leader at the intersection of marketing, data science, and technology with 15+ years’ experience. He has helped businesses increase their revenue and profitability by teaching them how to employ data storytelling, analytics, processes and tools to improve business performance.
He is an MBA from NMIMS, Mumbai and has worked with and consulted with some leading Indian and global companies such as PayPal, eClerx Services, SAS Institute, Idea, Dell, Autodesk, Walmart, Citibank, Universal Music, GE, Lenovo among others.
His previous roles have been Senior Consultant with SAS Institute selling customer intelligence products involving marketing technology, AI and Visual Analytics, Vice President with eClerx Services for Data Science and Marketing Operations, Consultant with PayPal Singapore for Data & Marketing Operations.
Some real feedback from our workshops this year
“I had a review meeting with the leadership, 1 week after and making a deck felt so easy and the outcome was so powerful that I immediately contacted Neil for some additional guidance to deepen my skills further” - ( Ms K Ingale - Sr Digital Analytics Team - Vodafone Idea Ltd.)
He did a brilliant job of getting my whole team stretching their communication skills. Mind it, these people had 6-12 years of experience working with data before. It was a great combination of hard & soft skills training. (Mr F Rodrigues - Head, Business Insights & Data Labs - HDFC Life Insurance)
Program Design for the Virtual Academy
Module 1: Understanding the Audience
Starting with the audience and the core message in mind
- Building for the audience
- Segmenting and narrowing your audience
- Designing for the context
- Connecting to the core idea and message
- Exercise
Module 2: Deciding the right visual
What visual works for which message?
- Build your visual vocabulary
- Selecting the right visuals and charts
- The important chart rules (Do’s & Don’ts)
- Exercise
Module 3: Declutter the message
Eliminating the distractions and get to the right message
- Data ink ratio
- The V method for chart junk
- Konmari the clutter
- Visual order
- Slide rules
- Exercise
Module 4: Questioning the numbers
Practice with the mistakes of others
- Learning by looking at examples of good communication
- Good charts and bad charts
- Exercise
Module 5: Focus Attention
Deliberately manage the audience attention
- Focus attention on the right elements
- The use of colour in data
- Typography, imagery and icons
- Exercise
Module 6: Design and Aesthetic
Use design tips and tactics to get the edge
- Form vs Function
- Aesthetic
- Annotation and call outs
- Exercise
Module 7: Chart redesign
Makeovers to learn from
- Doing a visual redesign
- Makeovers of visuals
- Exercise
Module 8: Narrative Structure for a story
Connecting the story to the visuals and the message
- Learning from storytelling in movies, books and plays
- The 3 acts of the story
- Comparisons and story in data
- Humanising data
- Creating conflict: Hero vs Villain
- Exercise
Module 9: Presenting a Data Story
Practice and learn from peers
- Participants get to present a story
- Peer review and feedback
Module 10: Examples of Data Stories done well
Learn from the masters
- Example 1
- Example 2
- Path ahead
To Book a Seat , Contact us
If you are interested to know more , Please mail us at info@consultkpi.com